Quantifying Photovoltaic Frequency Content and Determining Filtering Potential for Stochastic Solar Resources Using HVAC Drive Control
Quantifying Photovoltaic Frequency Content and Determining Filtering Potential for Stochastic Solar Resources Using HVAC Drive Control
Daily 5 kHz rooftop solar data was previously collected for two years from two rooftop solar panels on Everitt Laboratory (see Figure 1). Continued analysis revealed the location and type of recording errors, inconsistencies, and missing data. Figure 2 illustrates a sample of that data segment consisting of some 6.6 billion short-circuit measurements. A program was written to automatically scan, identify, and flag segments of missing data such as the one afternoon highlighted in red. Clean up and normalization approaches have been drafted. After creating a full, continuous, and normalized data set, the photovoltaic (PV)/solar frequency-domain content will be analyzed. Energy sacrifices resulting from various MPPT (maximum power point tracking) update rates will be quantified. Depending on the initial results, the data may be sampled to make the analysis more manageable.
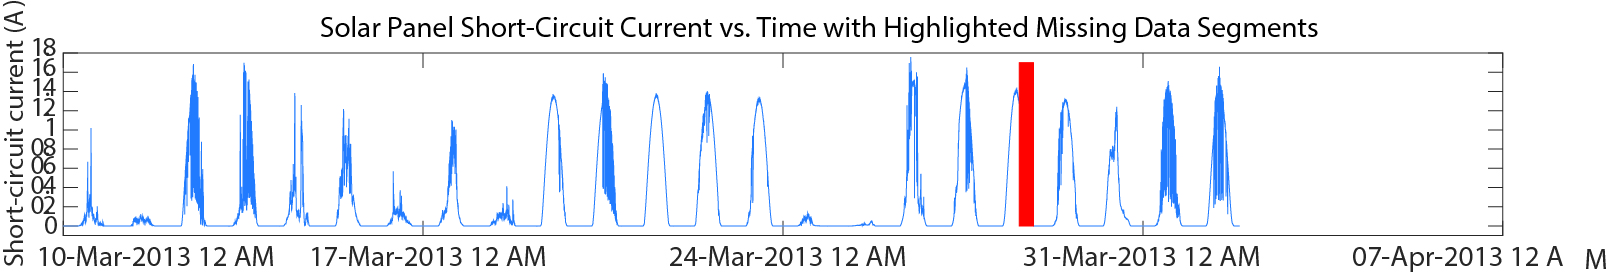
Figure 1 – Solar Panel Short-Circuit Current vs. Time with Highlighted Missing Data Segment
Our team is also using this revised data set to better model the load regulation capability of motor drives in HVAC (heating, ventilation, and air-conditioning) systems. When integrated with local, stochastic, solar power, properly controlled HVAC motor drives can act as an effective electric swing bus and partially negate PV power fluctuations. High-efficiency or net-zero buildings could act as more constant grid loads, or at least mitigate variances, by utilizing building thermal inertia. Acoustic bounds limiting the “filtering” potential of the blower were investigated. With an experimental set-up similar to that shown in Figure 3, an acoustic amplitude variation and ramp rate was determined. Then the total filtering capacity for a scaled, building-level implementation was modeled. Finally, the amount of solar energy fluctuation that this modeled system could filter was analyzed for buildings with varying solar power capacity.
This research is supported by the Grainger Center for Electric Machinery and Electromechanics.
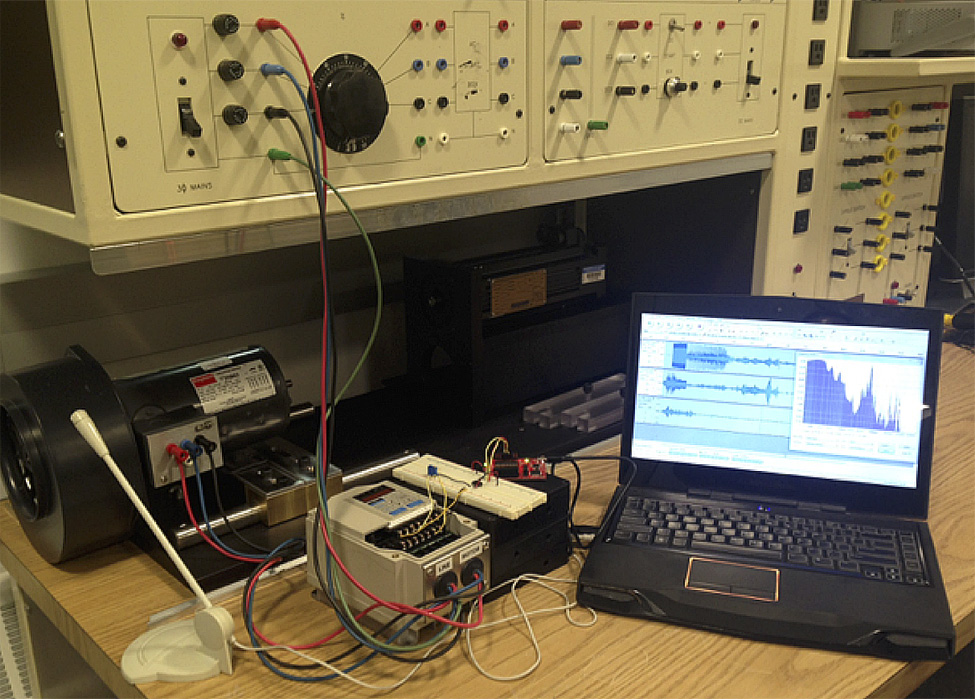
Figure 2 – Experimental set-up for acoustic monitoring of blower speed updates
The acoustic data is being taken in the Grainger Machine Lab/Power Electronics Laboratory (ECEB 4024) and the solar data was taken atop of Everitt Lab.