Power Draw Scheduling of Electric and Plug-in Hybrid Electric Vehicles with Unidirectional Vehicle-to-Grid Benefits
McDavis Fasugba with adviser P. T. Krein
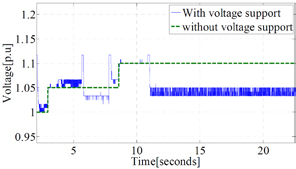
Figure 20: Voltage profile with EV support.
Electric vehicles and plug-in hybrid electric vehicles have the potential to offer benefits such as reactive power support and other ancillary services to the power system. This V2G interaction can provide economic benefits for both vehicle owners and utilities. In the V2G concept, information about prevailing system conditions flows from the grid to the EV, which uses that information to make decisions. The V2G concept is typically associated with bidirectional power flow—batteries charge and discharge. Given a significant penetration of EVs, and flexibility, unidirectional G2V) chargers can provide nearly the same benefits. In addition, unidirectional chargers avoid owner concerns about battery life and warranty and interfacing issues with respect to reverse power flow. Our research
addresses the reactive power support capability of unidirectional chargers, power demand scheduling schemes aimed at minimizing peak loading on a distribution feeder due to multiple charging EVs, and benefits provided to the EV owner.
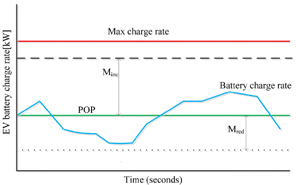
Figure 21: EV charging profile.
As the penetration of EVs increases, coordinated EV charging becomes necessary to reduce cost and manage feeder loading issues. Figure 20 gives experimental results showing charging EVs providing reactive power for local voltage support. When the voltage fell below 0.95 p.u., a defined amount of reactive power was injected. If the voltage exceeded 1.05 p.u., a defined amount of reactive power was absorbed. With significant EV penetration, the impact of reactive power support is substantial.
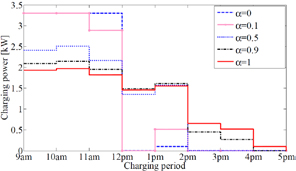
Figure 22: EV daytime charing period.
Active power regulation is performed with a unidirectional charging EV by modulating its charging rate about a preferred operating point (POP), the optimal scheduled power draw. The actual EV charge must integrate to the scheduled energy if the owner has contracted for a specified battery energy. Deviations from the POP provide regulation capacity. Extra revenue is based on this capacity. Figure 21 shows an EV charging profile with positive and negative capacity targets that fall within maximum and minimum allowed charging rates.
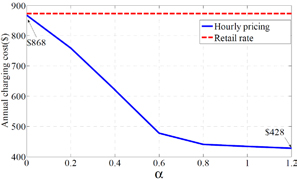
Figure 23: Annual charging cost to EV owners.
The utility sets the rate schedule and guarantees the amount of energy requested, but EV and PHEV owners can determine, based on hourly pricing, the hours and length of time over which they will charge their vehicles. If owners are able to allow a longer period to reach the desired charge or are willing to accept a partial charge during periods of high demand, they will generate more revenue for the utility and hence could be rewarded with
lower rates. Figure 22 shows an EV daytime charging profile. Here 10 kWh is requested. The EV owner will have a contractual arrangement to charge at a given level (α)The retail rate is charged for every kW above a charging rate of 3.3 kW unless higher charging rates are permitted by the utility. Figure 23 shows the annual cost benefits to EV owners. Notice that at a higher charging rate, the cost is greater than at a lower charging rate for the same amount of energy—a great incentive for flexibility. The annual cost savings is $440.
This research is supported in part through a grant from the Global Climate and Energy Project at Stanford University.