Graphical User Interface (GUI) Development for Testing and Monitoring of Distributed Control Algorithms over Emulated AC Microgrids
Oscar Azofeifa with advisor A.Dominguez-Garcia
The process of designing and implementing control architectures for distributed generation involves implementing hardware and software tools for their validation. Data visualization is used to detect system failures and show the system performance to correct these failures. In this work, we designed and developed a graphical user interface (GUI) to monitor and test various control algorithms and architectures proposed by our group.
We used an integrated development environment named Processing based on robust software tools (JavaScript, PostScript and OpenGL) that provides access to libraries for the creation of interactive visual tools. Our initial focus is to show the inherent dynamics of the distributed control schemes being tested in our C-HIL laboratory. We established a communication protocol between a central computer and microcontrollers (Arduinos), so they continuously send data of their iterative results. Figure 11(a) shows the results of one round of the ratio-consensus algorithm proposed for the 10-node case shown in Figure 10. Figure 11(b) shows a more interactive representation of the cyber layer—each block is a representation of the microcontrollers used for computation. The communication links (graph edges) are represented by moving arrows to show the data flow among the network. The GUI is also capable of showing system failures, for instance, one of the devices resetting and going off-synchrony with the rest of the system (see Figure 11 (c) as an example). This research is funded by Domínguez-García Cost-Share-Grant AC281.
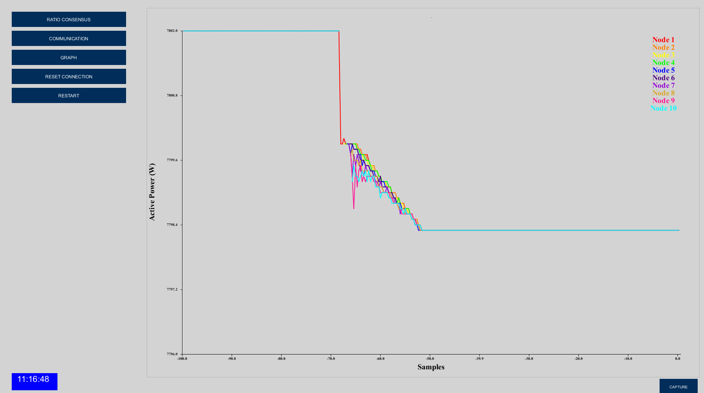
Figure 14: (a)
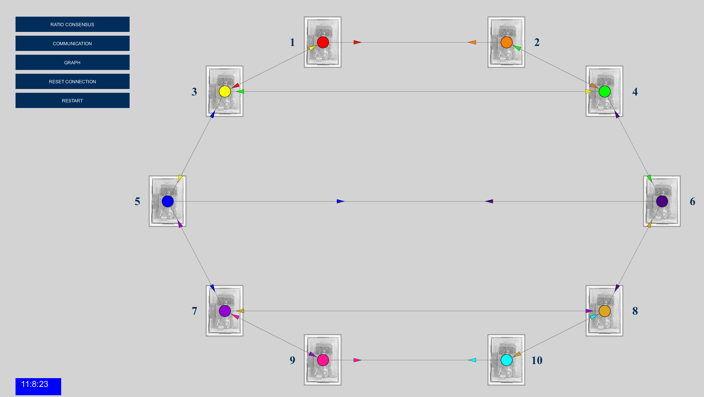
Figure 14: (b)
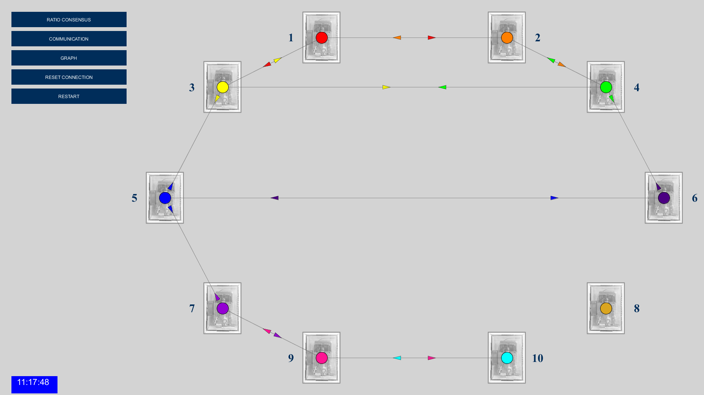
Figure 14(c): (a) GUI showing ratio consensus results for 10 nodes case (b) GUI showing cyber layer communications (c) GUI showing one node failure.
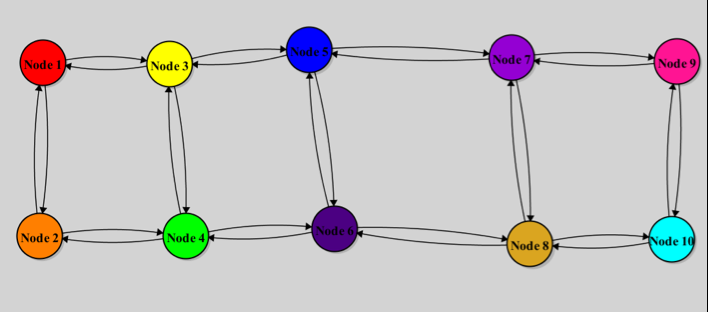
Figure 15: Communications graph for 10-node test