Algorithm to Determine Minimum Contingency Set in Voltage Collapse Scenarios
Jeremiah D. Smith with adviser Peter Sauer
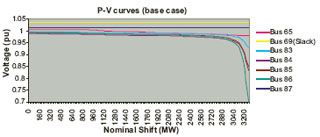
Figure 36: The p-v curves for chosen buses in the 118-bus system using a continuous load flow. This plot depicts some of the buses which exhibit sharp voltage decreases near the system collapse point.
This investigation stems from the relationship between real power load and voltage at transmission voltage levels, and the occurrence of steady-state bifurcations within a system. It deals with only static analysis, neglecting the dynamics that can contribute to voltage instability. The assumption is that changes in system parameters, specifically load growth, occur in a quasi-static fashion, allowing for the use of continuous load-flow calculations to collect data.
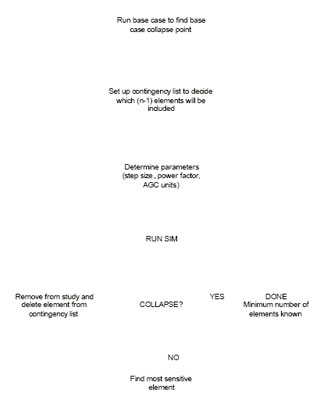
Figure 37: A flowchart for the minimum contingency set algorithm showing the iterative process used in determining the minimum number of elements needed to produce collapse.
The power-voltage (p-v) relationship at a given bus is used to illustrate p-v curves, which give insight to system robustness related to individual bus voltage. These data, which provide voltage information with respect to a system-wide parameter, are then used to form an elemental sensitivity for each contingency. This sensitivity is used to form an algorithm that can predict the minimum number of elements which can be outaged to cause system-wide voltage collapse. The test system used to conduct specific analysis of p-v curves was the IEEE 118-bus test system.
Detailed p-v curves were constructed using the 118-bus system to show the behavior of bus voltages. For clarity, only seven curves are displayed. These curves are chosen because out of all 118, their voltages are the most sensitive to growth in system load. Figure 36 illustrates the p-v curves of these buses.