A Set-Theoretic Framework to Assess the Impact of Variable Generation on Power Flow
Christine Chen with adviser A. Domínguez-García

Figure 23: Ellipsoids E1 and E2 bounding W (the set of all possible values that w can take), and corresponding ellipsoids. F1 and F2 bounding X (the set of all possible values that x can take).
Previously we investigated the impact of uncertainty in renewable resources on the small-signal dynamic performance of the power system at the electricity transmission level. In the past year, we extended the application to assess the effect of renewable resource uncertainty on bus voltages at the distribution level.

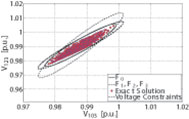
Figure24(a): 123-bus system: nonlinear power flow solutions and projections of state and line flow bounding ellipsoids. Illustration of ellipsoidal bounds and exact solutions of system states.
In the analysis, we assume the power generated from each renewable resource (denoted by w) which can be correlated with those from nearby resources, is unknown but bounded to an interval about a nominal operating point. We then bound the input uncertainty set with the intersection of several ellipsoids and propagate each through a linearized power system model to obtain the corresponding variations in bus voltage magnitudes and angles (denoted by x). This static performance assessment framework is depicted in Figure 23. If desired, we can also obtain the variations in variables that depend on bus voltages, such as the real power flow on a line.

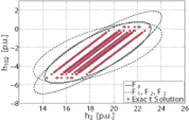
Figure 24: 123-bus system: nonlinear power flow solutions and projections of state and line flow bounding ellipsoids. Illustration of ellipsoidal bounds and exact solutions of line flows.
Finally, we plot these variations resulting from a particular level of uncertainty and check whether they are within performance requirements, e.g., whether voltage magnitudes are within a prescribed range of +/- 0.05 p.u. and whether line flows remain below the maximum allowable capacity. A sample of the results in shown in Figure 24 for a 123-bus distribution system with renewable resources added at 10 buses. This research is supported by the National Science Foundation under grant ECCS-0925754 and by the Natural Sciences and Engineering Research Council of Canada under its Postgraduate Scholarship Program.
This research is funded by the Grainger Center for Electric Machinery and Electromechanics.