Efficient Algorithms for Performance and Reliability Modeling and Analysis of Fault-Tolerant Systems
Frank Lam with adviser A. Domínguez-García
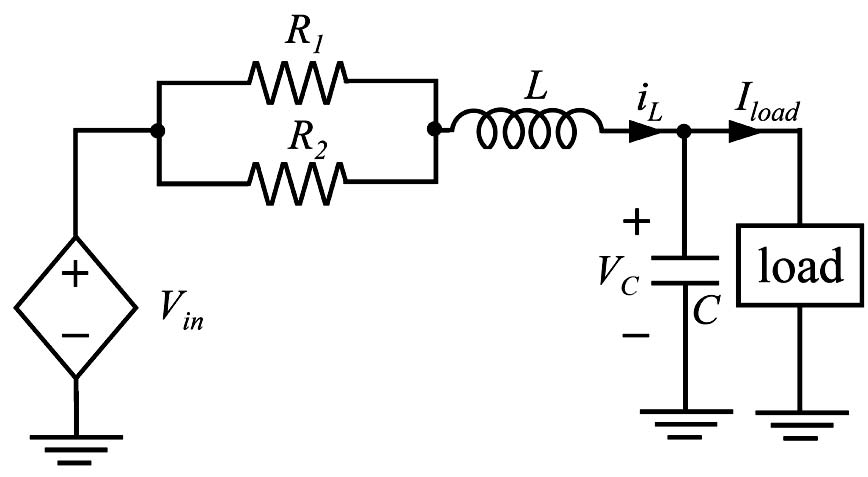
Figure 28: Simple circuit to test the standalone tool.
Reliability and fault-tolerance are essential qualities in the successful design and implementation of any electronic system to ensure the designs perform as intended. Accordingly, numerous tools have been developed to measure reliability and performance. Draper Laboratory possesses a proprietary MATLAB/Simulink performance and reliability simulation tool based on InPRESTo, a similar tool developed by Dr. Alejandro Domínguez-García while he was at the Massachusetts Institute of Technology. In the second half of 2008, the main focus of this research was to profile and develop algorithms to improve the efficiency and runtime of this tool when used for very large models.
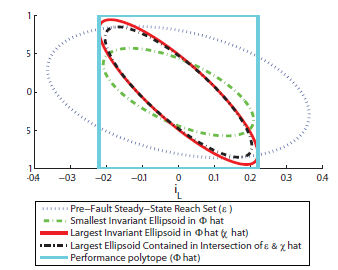
Figure 29: Ellipsoid shown taken from the graphic user interface.
In the first half of 2009, the research focus shifted to developing alternative approaches and algorithms to increase the tool’s effectiveness. One approach has been to expand its framework to a probabilistically-informed design. Presently, the tool takes one input, injects faults throughout the system, and computes the performance and reliability of the system for that one input. The goal is to determine the system’s fault coverage by analyzing it for all possible inputs using ellipsoids as bounds for the input and, accordingly, using ellipsoids to bound the pre-fault reach set. A fault is then injected, and the post-fault reach set is determined using the pre-fault reach set as the input to this faulted system. If the ellipsoid bounding the post-fault reach set falls within a defined performance polytope, then the system survives for all inputs despite the injected fault present.
Before incorporating the improved framework into the existing tool, a standalone tool was first created to test the accuracy of the algorithm. Using a simple circuit (seen in Figure 28) consisting of two parallel resistors in series with an inductor and a parallel combination of a load and capacitor to test in the standalone tool, the data was entered into the graphic user interface, and is shown in Figure 29. Fault coverage was computed and compared with the actual fault coverage found using 10,000 Monte Carlo simulations. The difference between the actual and computed fault coverage was 53.02%. Future work will adjust the ellipsoid algorithm to determine tighter and better bounds to reduce the error seen in the fault coverage computation.
This work was supported by funding from Draper Laboratory, Draper SC001-337.